The Business Research Company’s Digital Therapeutics Market Global Market Report 2026 – Market Size, Trends, And Forecast 2026-2035
LONDON, GREATER LONDON, UNITED KINGDOM, October 26, 2026 /EINPresswire.com/ — “The digital therapeutics market is carving out a significant niche within the broader digital health landscape, showing remarkable promise for the future of healthcare. As technology and healthcare converge, digital therapeutics are set to transform disease management, offering scalable, evidence-based solutions that complement or replace traditional treatments. Let’s explore the current market size, regional leadership, key growth factors, and the competitive dynamics shaping this rapidly evolving sector.
Market Valuation and Position Within the Healthcare Industry
The digital therapeutics sector is projected to surpass $38 billion by 2030. When compared to its parent digital health market, expected to reach approximately $662 billion by the same year, digital therapeutics will make up around 6% of this broader market. Within the vast healthcare services industry, which is anticipated to be valued at $11,335 billion by 2030, digital therapeutics will account for nearly 0.3% of the overall market worth, highlighting its growing but still emerging presence.
Request A Free Sample Of The Digital Therapeutics Market Report
https://thebusinessresearchcompany.com/sample_request?id=72156698&type=smp&name=Digital%20Therapeutics%20Market%20Report%202026&utm_source=EINPresswire&utm_medium=Paid&utm_campaign=Oct_PR
North America Leading the Digital Therapeutics Market in 2030
By 2030, North America is set to dominate the digital therapeutics market with a valuation of $19 billion. This region will experience rapid expansion from $6 billion in 2025, growing at a compound annual growth rate (CAGR) of 28%. This surge is driven by several factors including increasing integration of prescription digital therapeutics into healthcare systems, the incorporation of digital care tools with electronic health records, favorable reimbursement policies for digital health innovations, and the rising incidence of chronic diseases that benefit from ongoing remote management. Additionally, investments from healthcare providers and tech companies into personalized digital treatment options are accelerating market growth.
The United States To Remain the Top Country in Digital Therapeutics by 2030
The USA is projected to be the largest individual country market within digital therapeutics by 2030, valued at $13 billion. Starting from $4 billion in 2025, the market here is anticipated to grow at a CAGR of 24%. This rapid growth is fueled by factors such as the swift commercialization of FDA-approved digital therapeutic solutions, broader employer adoption of digital health initiatives aimed at cutting healthcare costs, widespread use of smartphones and connected health devices, strategic partnerships between pharmaceutical firms and digital therapeutics developers, and increasing patient preference for evidence-based software-driven disease management.
Access The Detailed Digital Therapeutics Market Report Here
https://thebusinessresearchcompany.com/report/digital-therapeutics-global-market-report?utm_source=EINPresswire&utm_medium=Paid&utm_campaign=Oct_PR
Software Segment Expected to Dominate the Digital Therapeutics Market
When segmented by product type, software is forecasted to be the largest category, accounting for 64% or $24 billion of the market in 2030. The software segment’s growth is supported by the rise of AI-driven therapeutic applications, the expansion of cloud-based digital health platforms, and an increasing demand for scalable, personalized treatment solutions. Continuous remote software updates and growing clinical evidence showing improved patient adherence and long-term health benefits further bolster this segment.
Digital Therapeutics Market Divided by Sales Channels and Applications
The market is also segmented by sales channels into business-to-business (B2B) and business-to-consumer (B2C). Additionally, it is categorized by applications, which include preventive care and treatment or care-related applications, reflecting the broad scope of digital therapeutics in healthcare.
Rapid Growth Rate Expected for Digital Therapeutics Through 2030
The digital therapeutics market is forecasted to grow at a robust CAGR of 28% leading up to 2030, signaling strong and sustained demand for these innovative healthcare solutions worldwide.
Key Factors Propelling Growth in the Digital Therapeutics Market
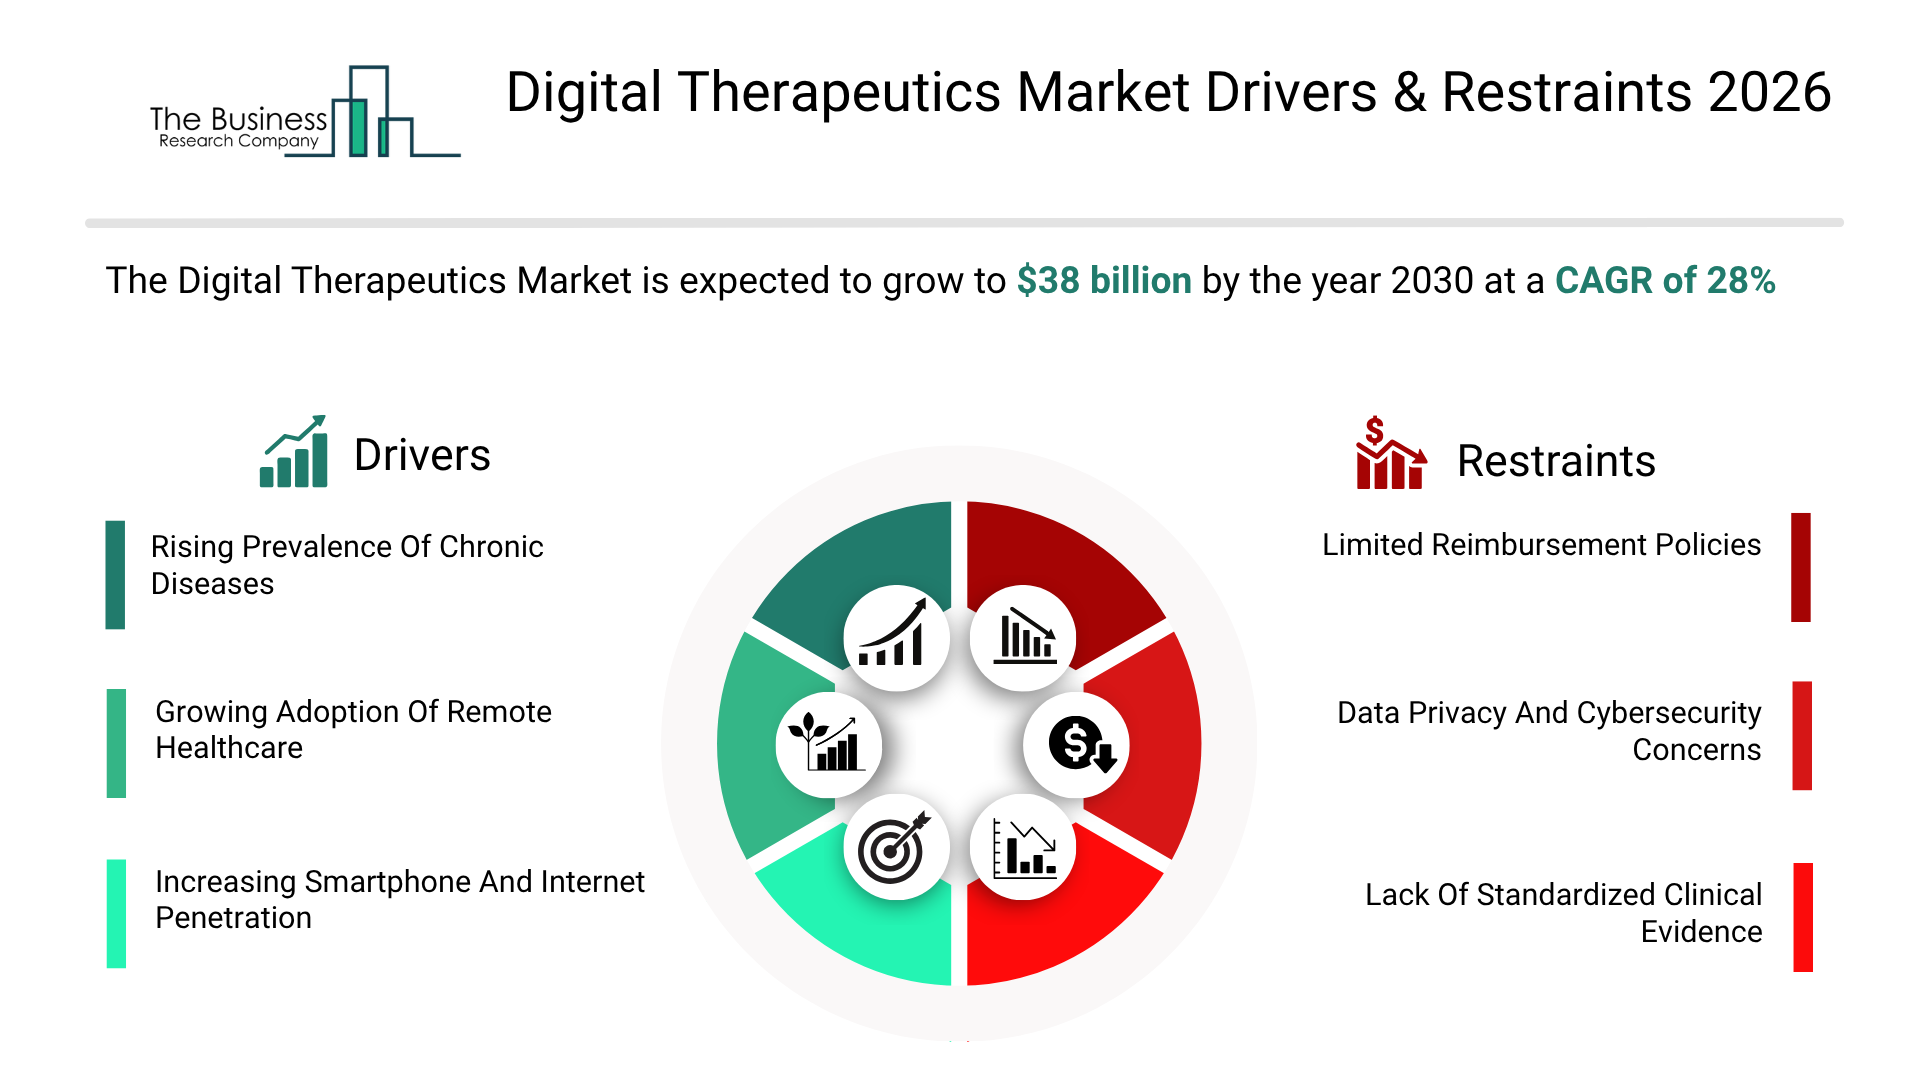
One major contributor to the market’s expansion is the rising prevalence of chronic diseases. Conditions such as diabetes, cardiovascular ailments, respiratory disorders, and mental health issues are becoming more widespread, increasing the need for continuous, personalized care that goes beyond conventional clinical interventions. Digital therapeutics facilitate long-term management through real-time monitoring, behavior modification programs, and validated treatment plans which improve health outcomes while reducing costs. Healthcare providers are increasingly adopting these digital tools to manage chronic diseases on a large scale, expected to add roughly 2.4% annual growth to the market.
Increasing acceptance of remote healthcare models is another vital growth driver. The surge in telehealth services is encouraging providers to embed digital therapeutics within virtual care pathways, enabling continuous patient engagement outside of traditional clinical settings. These technologies offer remote monitoring, personalized therapy delivery, and timely clinical intervention, all of which enhance treatment adherence and accessibility. As home-based healthcare gains traction, demand for digital therapeutics platforms grows, contributing about 2.2% to annual market growth.
The expanding reach of smartphones and internet connectivity acts as a significant catalyst for market development. Access to mobile devices and high-speed internet allows patients globally to engage conveniently with prescribed therapeutic programs, receive tailored health advice, and maintain continuous communication with healthcare providers via mobile platforms. As digital infrastructure improves worldwide, the adoption of digital therapeutics is expected to accelerate across diverse patient populations, contributing approximately 2.0% annual growth.
Growth Opportunities Within the Software and Devices Segments
The most promising opportunities lie in the software and devices sectors, which together are projected to exceed $27 billion in value by 2030. These gains are driven by rising adoption of prescription digital therapeutics, greater AI and data analytics integration into treatment platforms, expanding investments in connected health technologies, and demand for personalized therapeutic solutions. Continuous clinical validation and technological advancements support scalable, evidence-based care, fueling rapid growth throughout the digital therapeutics ecosystem.
Between 2025 and 2030, the software segment is expected to expand by $17 billion, while the devices segment will grow by $10 billion. The market is populated by a mix of established digital health innovators and healthcare technology providers focused on delivering clinically validated software therapies, AI-enabled patient engagement tools, remote care integration, and regulatory-compliant digital treatments. Emphasis remains on treatment efficacy, patient adherence, interoperability, scalability for chronic disease management, and adherence to evolving healthcare regulations as key to competitive positioning.
Top Market Player Leading Digital Therapeutics in 2025
Teladoc Health Inc. led global digital therapeutics sales in 2025 with a 3% market share. The company’s portfolio includes AI-driven chronic care management, virtual behavioral health, diabetes and hypertension management, and personalized digital treatment programs that enable continuous patient monitoring, clinically guided interventions, and improved healthcare accessibility across diverse populations.
Major Companies Shaping the Digital Therapeutics Market
Prominent players in this space include Teladoc Health Inc., Omada Health Inc., Medtronic plc, Virta Health Corp., Noom Health Inc., Propeller Health, DarioHealth, WellDoc Inc., Biofourmis Inc., Pear Therapeutics, Kaia Health, Big Health, One Drop Inc., CogniFit Ltd., Better Therapeutics, IQVIA, Xealth, Emulate Therapeutics, Canary Health Inc., SilverCloud Health, Akili Interactive Labs, Lark Health, JOGO Health, 2Morrow Inc., Prosoma, and Happify Health.
Market Fragmentation and Competitive Landscape
The digital therapeutics market remains fragmented, with the top 10 companies accounting for just 6% of total market revenue in 2025. This reflects ongoing challenges including clinical validation, reimbursement complexities, diverse therapeutic categories, software development needs, and regulatory compliance pressures. Leading firms such as Teladoc Health Inc., Omada Health Inc., Medtronic plc, Virta Health Corp., Noom Health Inc., Propeller Health, DarioHealth, WellDoc Inc., Biofourmis Inc., and Pear Therapeutics maintain notable shares by offering comprehensive digital care platforms, clinically proven therapies, strategic healthcare collaborations, and broad disease management portfolios. Growing demand for personalized care, remote patient monitoring, prescription digital therapeutics, and AI-enhanced solutions will drive further platform innovation and clinical evidence generation, strengthening these companies’ positions.
Key Raw Material Suppliers Supporting the Market
Critical raw material suppliers enabling the digital therapeutics market include technology giants like Microsoft Corporation, Amazon Web Services, Google Cloud, Oracle Corporation, SAP SE, Salesforce Inc., NVIDIA Corporation, Qualcomm Technologies Inc., Intel Corporation, Arm Holdings plc, Synopsys Inc., Red Hat Inc., MongoDB Inc., Snowflake Inc., Twilio Inc., Cloudflare Inc., Okta Inc., and Datadog Inc.
Wholesale and Distribution Channels in Digital Therapeutics
Major wholesalers and distributors include IQVIA, Ingram Micro Inc., TD SYNNEX Corporation, Carahsoft Technology Corp., SHI International Corp., CDW Corporation, Insight Enterprises Inc., Softchoice Corporation, Arrow Electronics Inc., Tech Data, Cardinal Health Inc., McKesson Corporation, Cencora Inc., Henry Schein Inc., EMIS Group plc, Xealth, Redox Inc., and Innovaccer Inc.
Primary End Users of Digital Therapeutics Solutions
Key end users in this sector are leading healthcare organizations such as Mayo Clinic, Cleveland Clinic, Kaiser Permanente, HCA Healthcare, Ascension Health, CommonSpirit Health, Mass General Brigham, Intermountain Health, Veterans Health Administration, National Health Service, CVS Health, UnitedHealth Group, Cigna Healthcare, Humana Inc., Aetna, Blue Cross Blue Shield Association, Apollo Hospitals, Fortis Healthcare, and Ramsay Health Care.
Competitive Trends Transforming the Digital Therapeutics Market
Partnerships built around AI-enabled digital care platforms are revolutionizing chronic disease management by enhancing system interoperability and delivering personalized patient care within connected health ecosystems. For example, in June 2026, Welldoc teamed up with Senseonics to create a next-generation mobile app for the Eversense 365 continuous glucose monitoring system. This collaboration integrates AI-driven health management with advanced digital care features, improving medication management, metabolic tracking, and user experience. Enhanced interoperability with Apple Health and Google Health Connect supports personalized diabetes care, boosts patient engagement, and facilitates better long-term clinical outcomes.
Strategies Companies Are Employing to Maintain Market Leadership
Organizations are focusing on AI-powered personalized therapeutics to improve patient engagement and outcomes, broadening prescription digital therapeutics across chronic disease areas, integrating remote patient monitoring to support connected care delivery, forging strategic collaborations to advance platform interoperability, and prioritizing clinical validation alongside regulatory approvals to accelerate market adoption. These approaches are key to sustaining growth in the competitive digital therapeutics landscape.
Our 2026 reports feature deeper market intelligence with market attractiveness scoring and analysis, total addressable market (TAM) analysis, company scoring matrix graphics and tables, Excel-based forecasting dashboards, market hotspots infographics, key technologies and future trend analysis, and updated graphics and tables.
Learn More About The Business Research Company
The Business Research Company (www.thebusinessresearchcompany.com) is a leading market intelligence firm renowned for its expertise in company, market, and consumer research. We have published over 30,000+ reports across 27 industries and 60+ geographies. Our research is powered by 1,500,000 datasets, extensive secondary research, and exclusive insights from interviews with industry leaders.
We provide continuous and custom research services, offering a range of specialized packages tailored to your needs, including Market Entry Research Package, Competitor Tracking Package, Supplier & Distributor Package and much more.
Disclaimer: Please note that the findings, conclusions and recommendations that TBRC Business Research Pvt Ltd delivers are based on information gathered in good faith from both primary and secondary sources, whose accuracy we are not always in a position to guarantee. As such TBRC Business Research Pvt Ltd can accept no liability whatever for actions taken based on any information that may subsequently prove to be incorrect. Analysis and findings included in TBRC reports and presentations are our estimates, opinions and are not intended as statements of fact or investment guidance.
Contact Us:
The Business Research Company
Americas +1 310-496-7795
Europe +44 7882 955267
Asia & Others +44 7882 955267 & +91 8897263534
Email: marketing@tbrc.info
Follow Us On:
LinkedIn: https://in.linkedin.com/company/the-business-research-company“
Oliver Guirdham
The Business Research Company
+44 7882 955267
info@tbrc.info
Visit us on social media:
LinkedIn
Facebook
X
Legal Disclaimer:
EIN Presswire provides this news content “as is” without warranty of any kind. We do not accept any responsibility or liability
for the accuracy, content, images, videos, licenses, completeness, legality, or reliability of the information contained in this
article. If you have any complaints or copyright issues related to this article, kindly contact the author above.

Media gallery